Friday 28 June 2019

S&P 500 with Update 3rd July

This revised weekly chart for the S&P 500 futures sees the next ATH as the end point of the bull super-cycle. Accordingly this view expects a super-cycle degree bear trend to gradually ensue.  


The hourly S&P 500 index chart explores the internals of the Primary [5] wave.


Update 3rd July:
This 30 minute chart re-examines Intermediate wave (5)


Like all of the charts that I post, this pattern analysis employs the standard version of the Elliott Wave Theory and is intended only to demonstrate my own momentary view within my own application of that theory.

Thursday 27 June 2019

Gold Spot, XAU/USD (hourly)

This hourly chart of XAU/USD now appears to be entering Minuette wave (v) of Minute wave [iii]


Like all of the charts that I post, this pattern analysis employs the standard version of the Elliott Wave Theory and is intended only to demonstrate my own momentary view within my own application of that theory.

Wednesday 26 June 2019

US Dollar Index, DXY

This daily chart for DXY continues to indicate the probability of the commencement of the [C] wave of the Cycle degree correction. 


Saturday 22 June 2019

XAU/USD Spot Gold ($US/Oz)

Standard projections point to spot gold XAU/USD being at the mid-point resistance zone of the 3rd wave fractal cluster...


Friday 21 June 2019

JSE, Steinhoff, SNH

Steinhoff indicates that it is ready to go.


Naspers, New York, NPSNY

The [A]-[B] leg is not impulsive. The correction is of Cycle degree. The typical target is the 4th wave ending of one order less = Primary wave [4]. This target is also indicated by the equal legs abc projection.


nullamque causam


Like all of the charts that I post, this pattern analysis employs the standard version of the Elliott Wave Theory and is intended only to demonstrate my own momentary view within my own application of that theory.

Wednesday 19 June 2019

S&P 500 Index (4-Hourly)

This 4-hourly chart of the S&P 500 Index has a simple message.


Friday 14 June 2019

XAU/USD mid June (updated 20th June)

Looks like Minor wave 1 of Intermediate wave (3) of Primary wave [3].


The hourly view is quite clear and self-explanatory..


20th June:  The price has broken above Primary wave [1] of Cycle V as it launches within the 3rd wave fractal cluster of Primary wave [3], Intermediate wave (3) and Minor wave 3.


LINK:  Earlier Gold Charts


Like all of the charts that I post, this pattern analysis employs the standard version of the Elliott Wave Theory and is intended only to demonstrate my own momentary view within my own application of that theory.


Saturday 8 June 2019

Gold Spot (XAU/USD)

The sideways continuation of Intermediate wave (2) is decidedly possible, but this is currently seen as the alternate option.

XAU/USD has a correlation with DXY which has the following weekly view:
A weaker DXY will produce a stronger XAU/USD..


For XAU/USD: The projections of the larger fractals show that an eventual new ATH is on the cards.
The Cup and Handle pattern projection is revised to be $1467 (see Link: below) which is seen as too conservative for the typical Elliott projections. However, the situation of the Cup and Handle is bullish.

The hourly chart gives a replication set up..


LINK: XAU/USD Mid-June Update

The Elliott nominal projection for Minor wave 3 is..


The typical target for Minor wave 3 is $1568 (see chart above). This requires a Minor wave 3 height of close to 4 times that presently on the chart.

Add (2) - 2 = $105.75 to the target for 3 and this projected target for Intermediate (3) is $1673.75.
Each fractal can be similarly projected, for example..

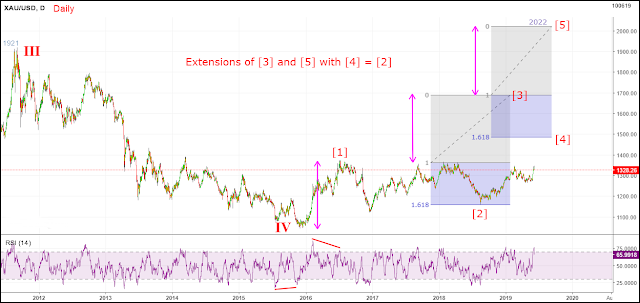
Projecting target for Primary wave [3] = [2] + 1.62 [1]  = $1655 to $1693 (two low points of  [2]). The above projection of (3) points to $1693 being more likely.

For Primary wave [5] see below:


LINK: Previous XAU/USD Charts
LINK: Newer XAU/USD Charts

Friday 7 June 2019

Nifty 50 Index (weekly)

This weekly chart indicates that from its 1992 origins the Nifty has produced three cycle-degree patterns. Cycle wave IV is expected to be a zigzag.


Nikkei 225 Index (weekly)

The data for the Nikkei 225 index produces a 19 year long super-cycle bear trend followed by a 10 year cycle order bull. The correction underway is cycle II with nominal target of Primary [4]


Thursday 6 June 2019

Swiss Index, SMI (Top)

This weekly chart of the SMI presents the Elliott wave theory with insurmountable challenges, until the abnormal stimulations and interventions are allowed for in the way of an extended 4th cycle followed by a similarly afflicted 5th cycle.


LINK:  China A50 (bear)
LINK:  S&P 500 Index (Top)
LINK:  Gold (XAU/USD)
LINK:  Nikkei 225 (bear)
LINK:  Nifty 50

Monday 3 June 2019

Naspers, NPSNY

This hourly chart of Naspers, New York displays a momentum fade and sell signal. The gaps can bring sideways action before the resumption of the bear trend. I will be following the RSI behaviour.


Sunday 2 June 2019

China A50

This weekly chart of the China A50 sees a Cycle degree top during 2015 and a questionable corrective Cycle thereafter. My take is that the correction is now negotiating Primary [C] and entering the Intermediate (C) wave. 


Saturday 1 June 2019

S$P 500 Index (weekly)

This weekly chart of the S&P 500 index suggests that we will be getting the long deserved consequence of the delinquent behaviour of unregulated capitalism and related greed.
Otherwise known as what goes undeservedly up must come down. 
And who better than than a deluded believer in unregulated capitalism to be the witless cheerleader.
(Not that there are any better candidates).
Unfortunately for the common man it is a story of theft of life support by those who have too much already and should know better. Just proves we are all with inadequate intelligence to protect ourselves from our own human nature.
So the FED spooked the market by giving a story of rate increases. The opaque buyback money-tree syndrome suddenly became transparent and revealed a market full of zombies. The crash had momentum enough to annihilate the markets until Trump intervened.
But now the market knows that it is on evaporating life support and it has been feeding on carcinogens. It knows that it must seek a cure for its self-inflicted cancer instead of just taking more pain-relieving opioids. The cancer has now reached the brain and the inevitable is now arriving. The buyback syndrome is ending and the zombies are coming out of hiding.
The longer the syndrome is maintained the worse the end result will be. But this has been the story for the last decade already and the end result has just been delayed and delayed whilst its prospective impact has been growing exponentially. The medicine has never been taken, but the world moves on and toys with concepts such as alternatives to the unsavory banking model that is still in use. The Supercycle correction has plenty of room within which it can play out and probably needs to run into the next US Presidential cycle.


Technically, the chart indicates that the corrective cycle C4 was 9 years (extended by interventions that commenced following the dotcom bubble) and the C5 cycle leading to the conclusion of Supercycle SC1 has been manufactured over a further 10 year period. 
It is historical fact that the deregulation of the capital markets that were initiated by approvals given by the naive President Clinton and the over-lobbied (heavily bribed) Congress have brought about massive wrongdoing. Whilst cosmetics have been applied the gross wrongdoings have continued unabated and the Congress remains conflicted by its own corruption whilst Dems have seemingly concentrated most all of their time on distractions and deflections that have the symptoms of obsessive compulsive disorder and point to some very serious issues that are being avoided.

LINK: Spot Gold

LINK: Slowing Economy, Plunging Stocks Are Forcing The Fed’s Hand

LINK: China A50 (Weekly)

Gold Spot ($US/Oz) [revised]

Before proceeding to the 4-hour charts there is an overview of the spot $US Gold price since 1971. This monthly chart indicates that the fifth and last Cycle degree wave since the gold price was first floated is now underway and that Primary wave [3] is commencing. This period should see a return to a general desire for safe parking. When this fifth Cycle wave concludes the subsequent correction has a nominal target of C4. That future bear trend for Gold portends a corresponding bull trend for general equities.


The first of these 4-hourly charts projects the traditional cup and handle pattern breakout target. The Elliott wave notations are for decoration.


The second chart uses Elliott theory and Fib ratios to project the breakout leg (wave [iii]) action. The most recent highpoint is seen to be at the 50% point of the 3.62 projection of wave [i]  which may even turn out to be the case, but is nowhere near the cup and handle target.


The typical Elliott pattern projection gives 3 = $1568, [3] = $1690, [5] = $2022


LINK: Newer XAU/USD Charts

LINK: Download Elliott Theory by Robert Prechter